I’ve been doing research all day today. Just wanted to summarize some interesting findings.
A. Classes of ETNs
Below are charts of each pair of 3x leveraged ETNs (Exchange Traded Notes). Will only post a couple of pairs since they all pretty much look the same. I just wanted to get a high-level understanding of the pair correlations and general trends at different timeframes. In fact, the following observations are sufficiently general and may apply to classes of N times leveraged Bullish and Bearish, so the strategy is not confined to a strict matching of ETN pairs. For example, to track the S&P500, ProShares provides the 3x $UPRO and -3x $SPXU ETNs, while Direxion provides the analogous 3x $SPXL and -3x $SPXS ETNs. Due to imperfect daily tracking, management fees, and other real-world trading issues, each officially inversely-correlated pair are only inverse up to some band of variation anyways.
It seems that the utility of treating these ETNs as classes help to mitigate some problems around liquidity: bid-ask spreads and volume, both of the underlying ETNs and their options chains. Since the corresponding 3x leveraged ETNs from Direxion, VelocityShares, and/or ProShares can be substituted for each other, they effectively becomes a set of closely-related leveraged bearish/bullish ETNs that constitute an meta-ETN that may mitigate problems with liquidity in any one of the constituents.
Top row is the bullish ticker, and bottom row is the bearish ticker. Going left to right are 3 months, 3 years, and 10 years.


– Observations
- 3 Month: daily inverse correlation seems very strong, as expected
- 3 Year: Decay of the ETNs are clearly visible
- 10 Year: Decay makes the last couple of years not even show up!
B. Useful Articles
Below are links to useful articles with 1 or 2 important insights
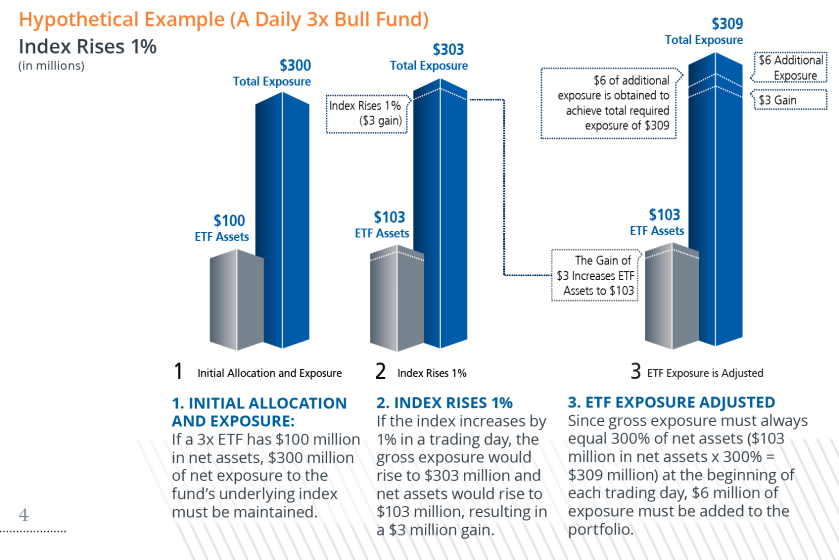
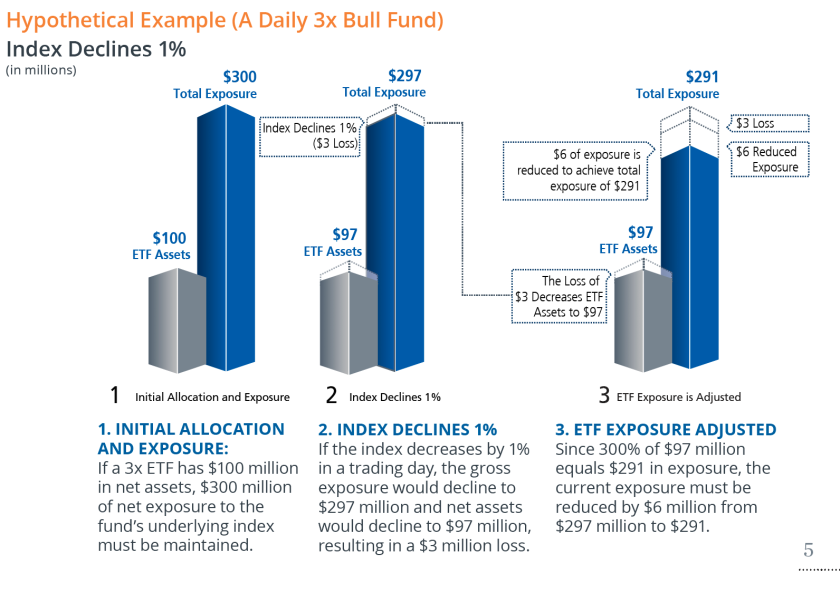
1. Direxion Website: Understanding Leveraged ETFs (pdf)
Two very good graphics showing how leveraged ETNs are rebalanced. The important thing to note here is that the very nature of the ETN construction is such that the fund is forced to “Buy High and Sell Low.” Taking a step back, this strategy would necessarily cause a loss in fund value, with the exception of a strongly trending market. And this is before any management fees are charged to the assets.
2. Dane Van Domelan – Clearing Up Some Beta Slippage Myths

Takeaway: To maximize the effects of Beta slippage, choose ETNs with as low a Sharpe ratio as possible, as in having returns as close to zero and volatility as high as possible. This
3. Eric Falkenstein – A Strategy for Shorting Leveraged ETF Pairs
Great old-ish article about this strategy, but what I really liked was the comment by a poster “Convoluted” about how shorting options may be a nicer refinement.

4. Fred Piard – Leveraged ETFs Decay Dashboard
Nice dashboard showing the decay rates of various ETN pairs. Slightly outdated since the article is 2.5 years old, and may need more ETNs pairs, but a good overview of various sectors.
5. Jonathan Kinlay – Investing In Leveraged ETFs – Theory And Practice
Nice article that highlights practical problems of shorting the underlying leveraged ETFs, especially with respect SLB (Short Lending and Borrowing) rates. This article has convinced me to focus initially on options rather than shorting the underlying directly, whenever possible.
